Proyek ini mengeksplorasi kinerja 50+ instrumen investasi di berbagai kelas aset—termasuk saham AS, saham Indonesia, indeks global, mata uang kripto utama, reksa dana, obligasi, dan komoditas. Semua kumpulan data dikumpulkan melalui alur scraping web Python otomatis menggunakan Requests, BeautifulSoup, dan berbagai API keuangan.
Fokus Analisis
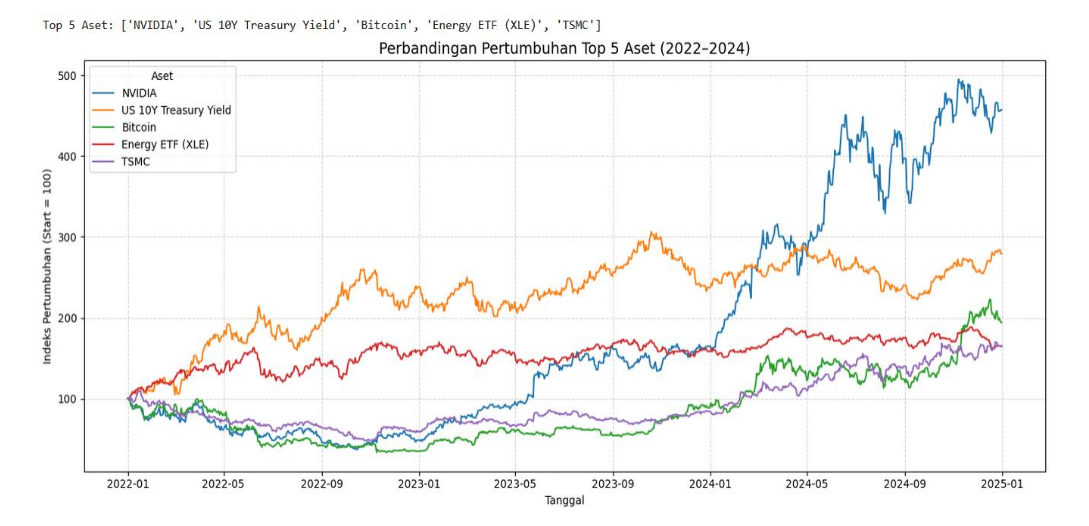
Analisis ini berfokus pada mengidentifikasi pengembalian tertinggi dan aset paling stabil dari tahun 2022 hingga 2024, menggunakan metrik seperti return YoY, CAGR, volatilitas, dan Sharpe Ratio. Hasil Akhirnya adalah perbandingan berbasis data yang jelas di berbagai pasar dan kategori risiko, menyoroti aset mana yang secara konsisten berkinerja lebih baik di segmen masing-masing.
Eksekusi Teknis
Di luar wawasan investasi, proyek ini mendemonstrasikan kapabilitas teknis dalam pengumpulan data, pembersihan, visualisasi, dan interpretasi kuantitatif—menampilkan perpaduan antara keterampilan pemrograman dan pemikiran analitis.
🧩 Area Topik
Analisis Data Keuangan, Scraping Web Python, Riset Kuantitatif, Perbandingan Multi-Aset
🛠️ Keahlian yang Digunakan
- Python (Scraping & Pemrosesan Data)
- Pandas + NumPy
- Matplotlib / Visualisasi
- Analisis Metrik Keuangan
- Pembersihan & Penstrukturan Data
⭐ Fitur Utama
- Alur Scraping Otomatis: Pengumpulan data otomatis untuk data keuangan real-time dan historis.
- Perbandingan Multi-Aset: Analisis kinerja di 9–10 kelas investasi yang berbeda.
- Metrik Kuantitatif: Perhitungan CAGR, return YoY, Sharpe Ratio, dan volatilitas untuk analisis berbasis risiko.
- Visualisasi Tren: Representasi grafis dari tren kinerja multi-tahun dan tren pasar.
- Kategorisasi Kinerja: Identifikasi dan peringkat aset dengan kinerja terbaik yang jelas.